VISUAL MANAGEMENT
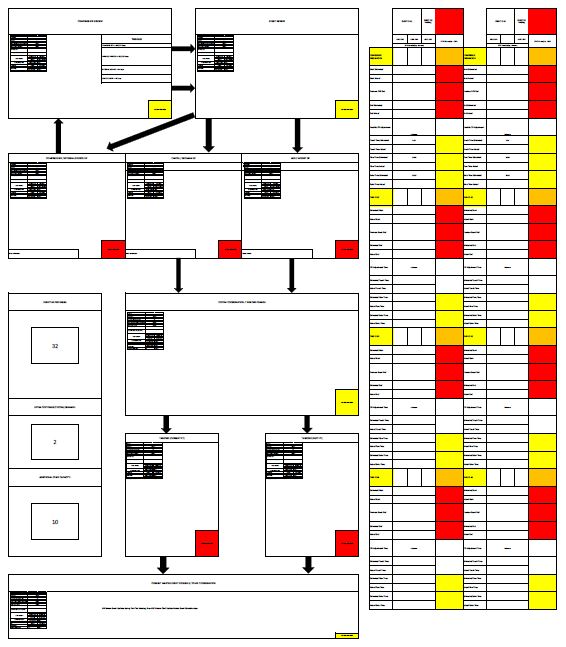
Each element of a Visual Control provides key information about the system or process. Each indicator (colored blocks) is a binary cue to the supervisor or leadership level that must engage to prevent a system barrier.
Included in a good Visual Control are information or material flow indicators (arrows) that represent subsequent steps for problem resolution.
When properly timed based on Value Stream Map information, a Visual Control will signal action steps to be taken that prevent a critical system shutdown.
About this project:
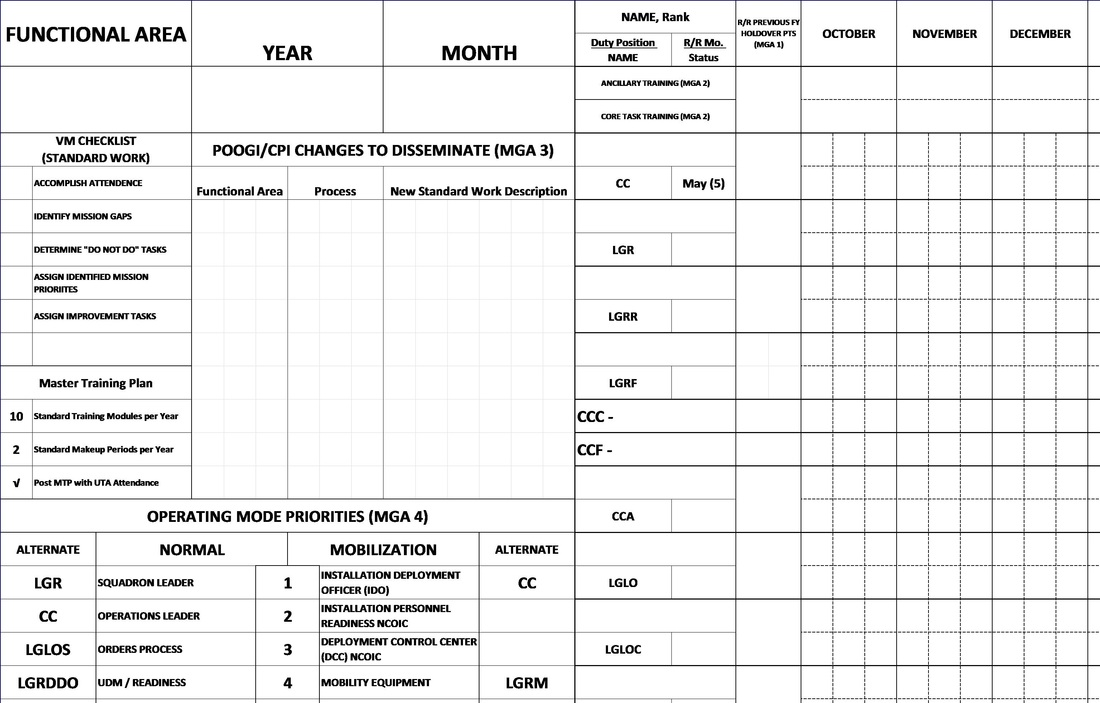
Information is best defined as "the answer to the question that is asked" (The Haystack Syndrome, Goldratt 1990). The extract above shows core components of a Visual Management Display that supports basic administrative business functions.
Information is best defined as "the answer to the question that is asked" (The Haystack Syndrome, Goldratt 1990). The extract above shows core components of a Visual Management Display that supports basic administrative business functions.
|
About this project:
Simple system indicators are required to identify and solve emerging process problems. This element of the Theater Security Cooperation process provides a component of standard work that highlights internal and external process barriers that are influenced by different management levels. This depiction shows the detailed elements that are managed by the process owner. For more information about this project, see our "Value Stream Mapping" page. |

FEVER CHART
A fever chart provides a visual representation of buffer utilization for continuous identification of challenges to on-time delivery. Managers at all levels can quickly determine if buffer utilization is on-target requiring no intervention, increasing requiring planning to return to planned use, or critical requiring the implementation of corrective plans.
Example Coming Soon

TEAM IDENTIFICATION
Description Coming Soon
Description Coming Soon